
Nearly 600 rows of historical sales data already hide the first answer: the G column holds satisfaction scores, and selecting it in Excel returns an average satisfaction value of 84%.
That is the pattern this piece follows. East China sits at 74%, which pulls the national average down, and a pivot table can turn that same sheet into a regional report by moving Region into Rows and Satisfaction into Values, then switching the calculation to Average. The same method can quickly break the data out by store type or by product line. The point is not that the dashboard looks better; it is that the question, the metric, and the decision path are fixed before the analysis starts, so the tool stays small enough to answer on time.
Pivot tables are enough when the question is simple and the metric is already named
Excel pivot tables are enough when the question is already narrow and the metric already exists. In the source table there are nearly 600 rows of historical sales data, and the G column holds satisfaction scores. Selecting that column shows an average satisfaction value of 84%. That is a complete answer when the task is to summarize one named metric.
The same table also shows why the method works only inside a structure that is already there. East China has a satisfaction score of 74%, which pulls down the national average of 84. A pivot table can turn that one-dimensional data into a regional view by dragging Region into Rows and Satisfaction into Values, then changing the calculation to Average. It can also split the same metric by store type or by product line, and it can place fields into Rows and Columns to build a two-dimensional display. This is fast because the dimension names are already known.
The move is not analysis from scratch; it is rearrangement.
That boundary matters. Pivot tables can create custom metrics through calculated fields, such as profit margin = (income - cost) / income, and they can group monthly data into quarterly data. They can even group income from 10000 to 20000 in intervals of 1000. But the method still depends on someone knowing the indicator, the dimension, and the operation before the table is built, which is why woshipm says a useful request format is indicator + dimension + operation. In that sense, the pivot table is an answer engine for a question that already has a shape.
AI can draft analysis, but it still depends on explicit inputs and review
Woshipm's standards for Codex, Trae, and Deepseek point to the same shift: AI can replace parts of Excel or Python work, but not the analysis question itself. The useful request format is indicator + dimension + operation, and the article says AI should not guess unclear business labels. That matters because data accuracy is the point where analysis either turns into something the business can use or stays as a draft.
The article also argues that by 2026 people will not need to memorize Excel or Python formulas if they can explain the operation steps clearly. That promise is narrower than it sounds. AI still needs the main indicator, a comparison standard, and a breakdown by dimensions and sub-indicators, which is why the article lays out nine monitoring steps before any result is treated as usable. Clear inputs come first.
That logic shows up in prompt design for modeling too. Woshipm says a useful prompt should define X and Y indicators, run descriptive statistics on X, suggest feature engineering, and then model with an XX model. For causal inference or forecasting, the user should prepare hypotheses and supporting data before asking AI to build anything. Sspai's pivot-table examples make the same point from another angle: a report can be built from Region and Satisfaction, and custom metrics like profit margin still require an explicit formula, income minus cost divided by income. The tool speeds the work. The person still has to name what counts.
Autonomous agents matter when the task chain is long and the environment is messy
Qiewen Academic shows what end-to-end automation can mean in research work. Fudan University's NLP team built it as an academic version of Codex, and appinn describes it as a fully automated research agent that can connect to servers, request GPUs, run experiments, and write literature reviews.
That reach matters because the system does the unglamorous setup work too. It can upload a PDF, judge experiment difficulty, estimate code usability, and size the A100 or H100 GPUs needed. If no card is available, it can apply for a GPU server, pick a recent PyTorch + CUDA image, connect to a remote server, and check SSH, GPU memory, RAM, and Python version. Short tasks stay simple; messy ones do not.
It also keeps going when the environment breaks. appinn says Qiewen Academic can face dependency conflicts such as Transformers 4.52 vs 5.3, downgrade packages, rewrite related scripts, and keep pushing until the pilot test runs successfully. It can take on 200 papers, organize a literature review in 9 categories, and produce more than 1000 words per paper with figures and formulas included. The article says it can generate more than 200,000 Chinese characters overnight.
That is very different from the analyst-control model in woshipm's guidance. There, AI is framed as replacing Excel or Python operations rather than data analysis itself, and the human still has to protect data accuracy and decide what labels mean. For causal inference or forecasting, the user prepares hypotheses and supporting data before asking AI to build models. Autonomy helps when the chain is long. Control still matters when the decision has to be right.
The real constraint is the action window, not the beauty of the report
SoFi's case shows the point. One week produced 546 same-type failed loan application sessions, and the users saw error messages instead of completing applications. Glassbox's anomaly detection reached SoFi before the technical problem entered SoFi's field of view, and the business and technical teams classified it as high priority, used session replay to find the root cause, and fixed it on the same day. Glassbox estimated that if the failure had lasted for one year, it could have caused more than 28,000 abandoned applications and more than $9 million in potential annual losses.
That is what a dashboard should be built to protect: the window for intervention. The article defines action window as the time between when a signal reaches executable reliability and the latest point when intervention can still significantly change the outcome, and it says that is not the same as an alert SLA.
The point is not a prettier report.
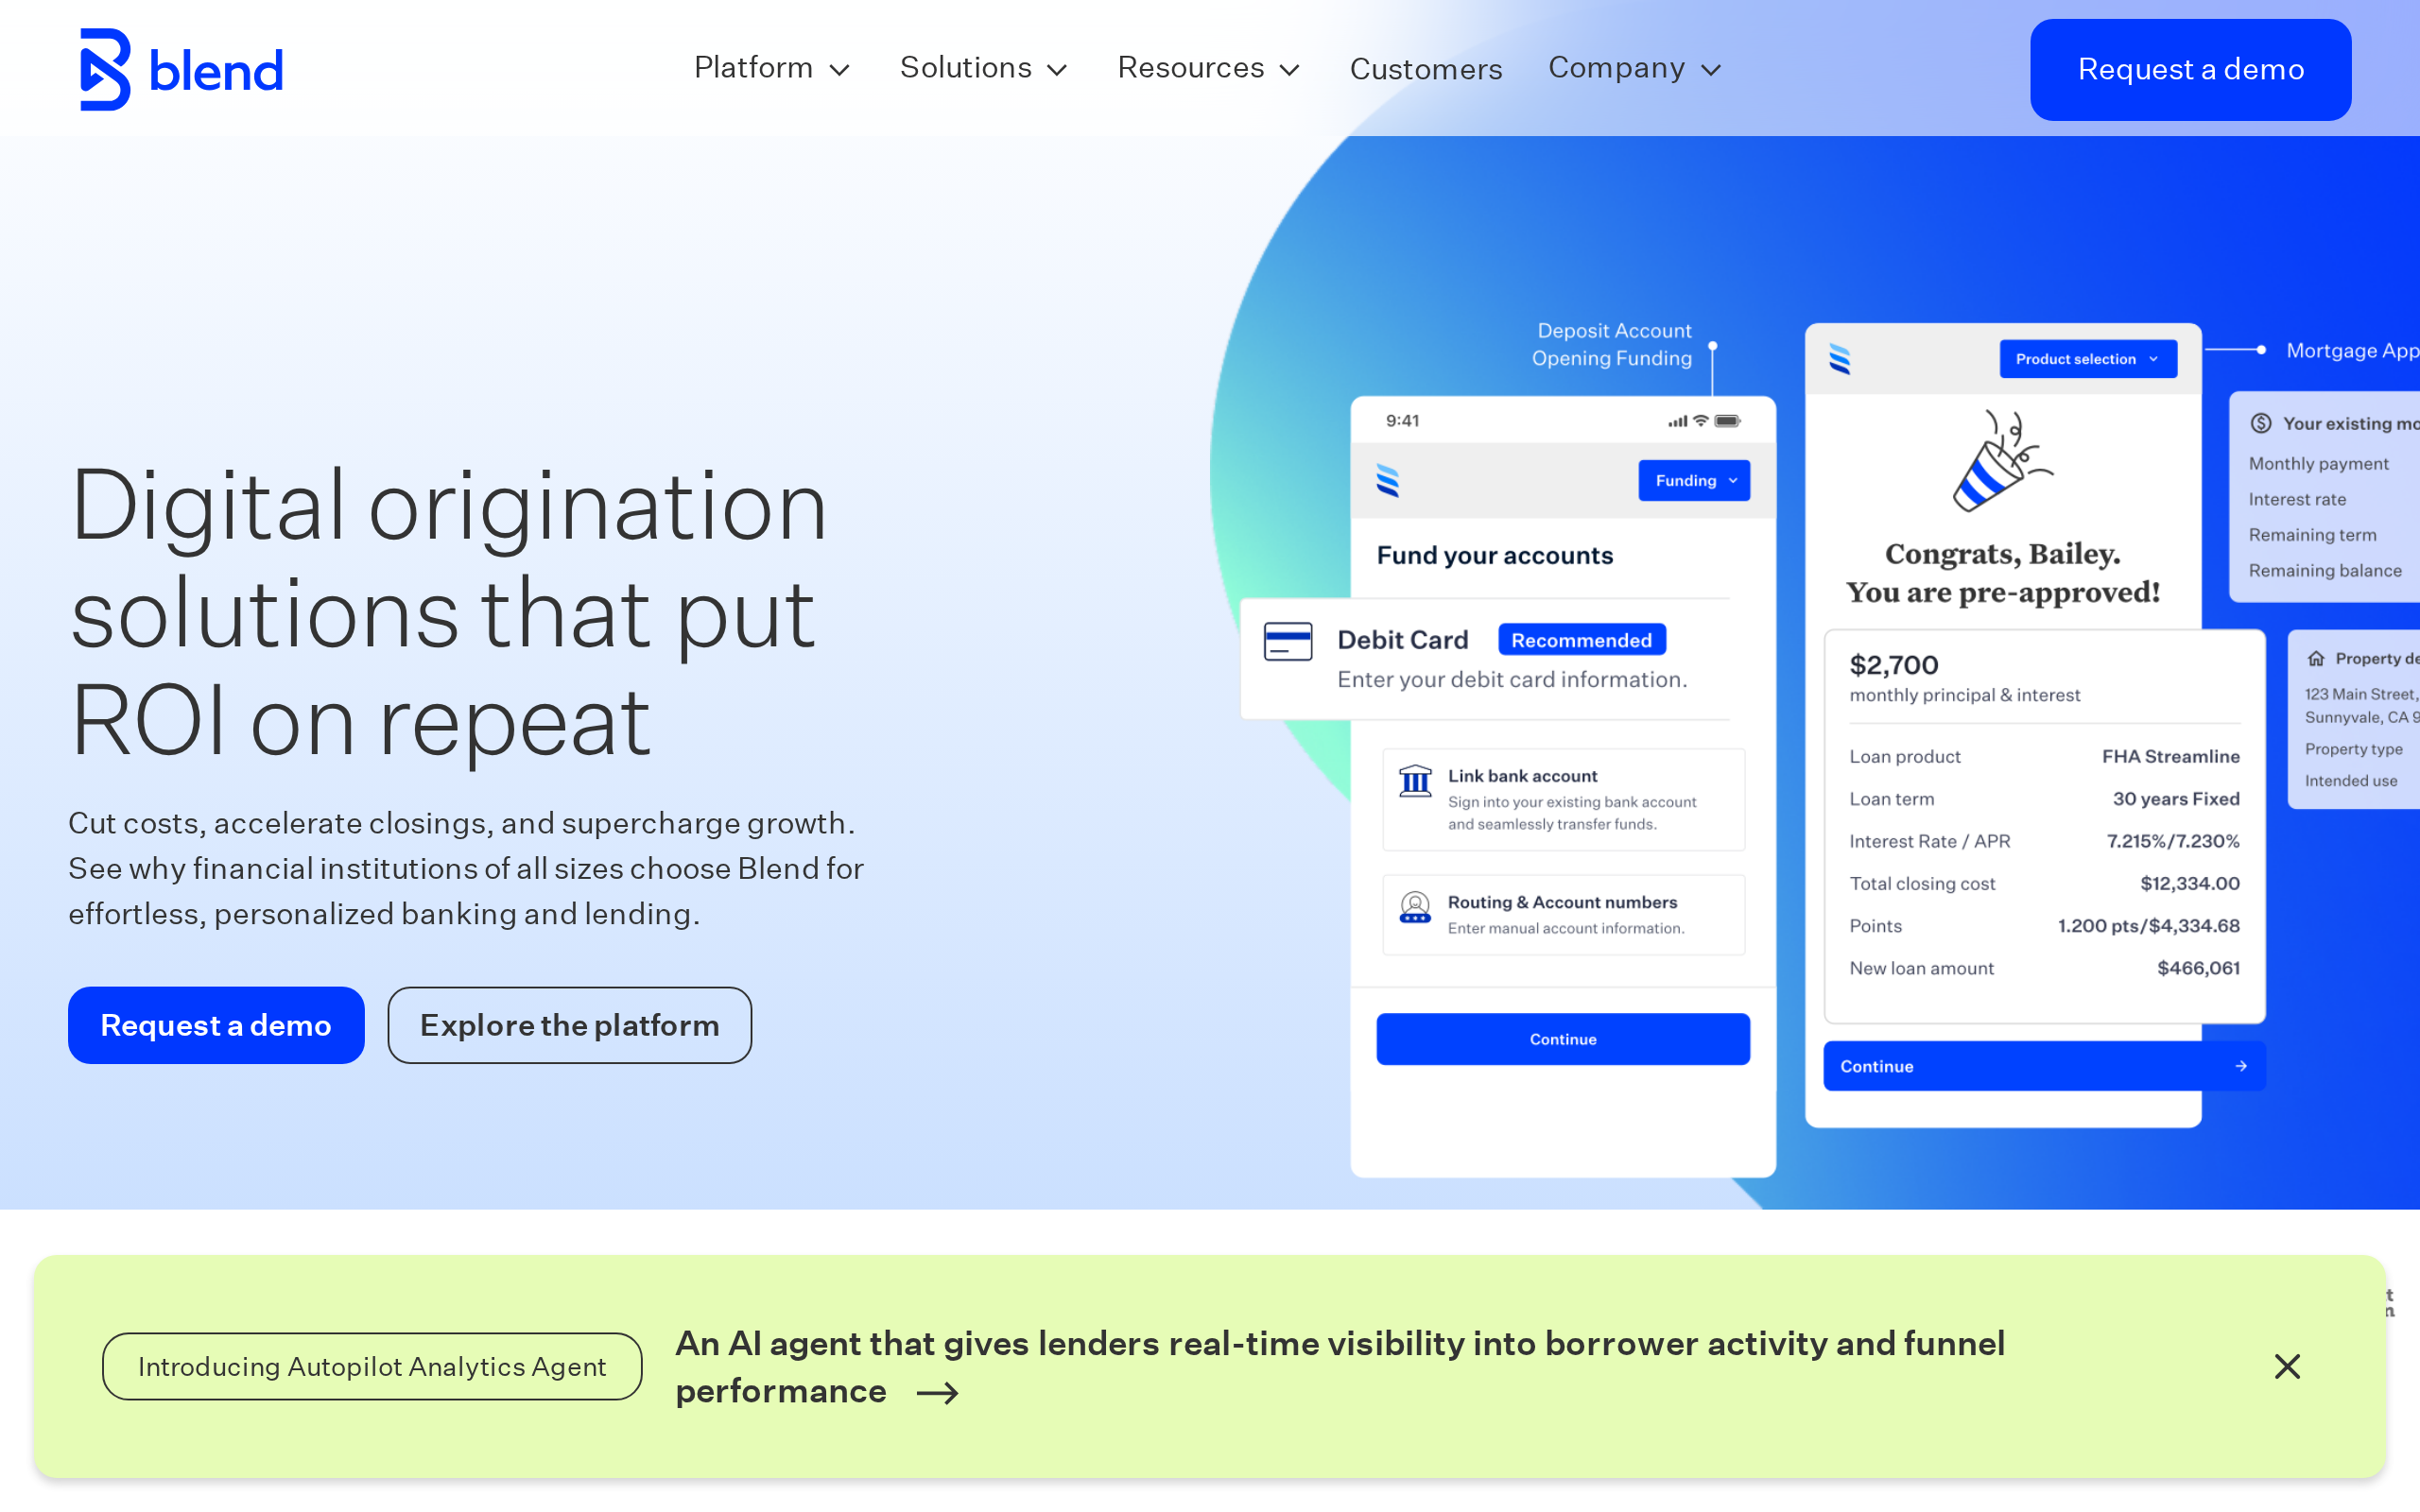
Blend's own framing is blunt about the business goal, and its product supports natural-language querying, real-time loan funnels, threshold alerts, and collaborative dashboards. It is a report tied to a remaining chance to act.
Blend's three measures make that operational. Current remaining window is the time from now until the latest effective intervention time. Time to Intervention runs from the moment a signal becomes reliable to the moment the prescribed action is completed and enters an effective state. Window hit rate then tracks how often the team actually finishes the action before the window closes, after confirming the signal and the execution conditions.
That matters because the article says a closed campaign can have a 30% conversion-rate drop, while a still-running campaign with only a 5% drop and four hours left may deserve attention first. AI does not need to be real-time in every scenario, but the output is useful only when many conclusions are actually used by the business.
When to use pivot tables, promptable AI, and autonomous agents in data work
- You already have structured Excel data and need fast descriptive breakdowns such as averages by region, store type, product line, or a two-dimensional revenue table. Use a pivot table. The sources show it can drag Region into Rows and Satisfaction into Values, switch the calculation to Average, place fields in Columns and Rows for a two-dimensional view, and quickly produce other summaries such as store type or product line.
- The question is not just reporting, but defining a metric or grouping rule that changes the shape of the analysis. Use pivot-table features such as calculated fields and grouping. The ledger gives profit margin = (income - cost) / income as an example of a calculated field, and shows grouping monthly data into quarterly data or grouping income from 10000 to 20000 in intervals of 1000.
- You need a business answer, but the business cannot yet state clear indicators, standards, or hypotheses. Do not jump straight to AI automation. The article says to first build an indicator system and monitor data, collect indicator trends plus industry data and KPI breakdowns to establish standards, or build business hypotheses and verify them one by one before asking AI to help.
- The problem is analysis plus execution, with a short window in which an intervention can still change the outcome. Use an agent or tightly connected analytics workflow only when the action window is short, the action is reversible, and the rules are mature. The article says scenarios with only a few minutes of window are the ones worth tightly connecting identification and execution, while weekly-window strategic problems may only need daily reports and manual review.
- You want AI to help with research, literature review, or paper reproduction rather than simple charting. Qiewen Academic fits when the task is research-heavy and you already know the target output. The sources say it can assess paper reproduction difficulty, code usability, and GPU needs, search the web for closest prior work, and produce long literature reviews; but the cited claims about full automation are presented as claims, not independently verified in the ledger.
A practical workflow: define the decision, then choose the least powerful tool that can still act in time
Start from the decision, then name the metric, then pick the least powerful tool that can still act before the window closes. That order is the guardrail. Woshipm defines the action window as the time between executable reliability and the latest point when intervention can still change the outcome, so the workflow begins with timing, not formatting.
If the request is a straightforward aggregation, a pivot table is enough. Sspai describes nearly 600 rows of historical sales data, and the report is built by dragging Region into Rows, Satisfaction into Values, and switching the calculation to Average. Pivot tables can also create custom metrics through calculated fields, and a slicer can update the table and linked chart with a click.
AI enters after the structure is clear. Woshipm says a useful request format is indicator + dimension + operation, and it treats data accuracy as the most important part of the work, with AI kept away from guessing unclear business labels. For causal inference or forecasting, the prompt should name X and Y, ask for descriptive statistics on X, then move into feature engineering and modeling with an XX model.
Escalate only when the task chain and timing justify it. Appinn says Fudan University's NLP team built Qiewen Academic, an academic version of Codex, and the system can connect to a remote server, check SSH, GPU memory, RAM, and Python version. That kind of agent fits the messier end of the spectrum. Woshipm's SoFi example shows the other side: a high-priority issue was found with session replay and fixed the same day, which is what tight identification and execution looks like when the window is short.
How the three tools frame analysis around structure, automation, and action
| Dimension | Excel pivot tables | Qiewen Academic | Blend Autopilot Analytics Agent | Article's analysis standard |
|---|---|---|---|---|
| Core purpose | Turn one-dimensional data into a two-dimensional display and summarize it | Act as an academic agent for research, paper reproduction, and literature work | Run this month's pipeline, not last month's report | Make analysis usable only when conclusions can be acted on |
| What it automates | Region, product, grouping, calculated fields, filtering, and quick report generation | Server connection, GPU selection, dependency repair, web search, paper review, and writing support | Natural-language querying, real-time loan funnels, threshold alerts, and collaborative dashboards | Monitoring main indicators, comparing against standards, and breaking down by dimensions and sub-indicators |
| What the user must already know | Which field is the metric, which dimension to split by, and which aggregation to use | What research question to ask, what paper gap matters, and what kind of experiment or review is needed | What signal matters, what action is available, and what outcome window still allows intervention | The indicator + dimension + operation format, plus clear business labels and decision criteria |
| How it treats structure | Uses Rows, Columns, Values, Group, and slicers to impose structure on data | Uses tools such as deep search, literature review organization, and paper-reproduction checks | Uses action window, current remaining window, Time to Intervention, and window hit rate | Argues that data work should begin with indicator systems, standards, hypothesis checks, or benchmark analysis |
| Relation to speed | Quickly generates satisfaction reports, revenue tables, and grouped summaries | Can produce a literature review of more than 200,000 Chinese characters overnight | Designed around response before the window closes rather than generic real-time behavior | Says AI does not need to be real-time in every scenario |
| Typical output | Average satisfaction by region, store type, product line, or regional-product revenue tables | Experiment feasibility, reproduction support, literature review, and translated content preserving formulas, charts, and layout | Alerts, dashboards, and funnel monitoring tied to intervention | Business analysis that is actually used by the business |
| Known limits or cautions | Not covered | Coupon code 197720 is limited in time and quantity, and its validity ends on 2026.8.29 | Action window is not the same as an alert SLA | AI should not be trusted to guess unclear business labels |
Start with the decision, then write the request as indicator + dimension + operation, because that is the shape woshipm says AI can act on. If the metric is unclear, do not let AI guess the business label; the article treats accuracy as the first guardrail.
For causal inference or forecasting, prepare hypotheses and supporting data before you ask for a model. When you need monitoring, follow the nine-step path: main indicator, compare it with a standard, then break it down by dimensions and sub-indicators. In practice, use AI to replace Excel or Python operations, not the analysis itself, and keep humans responsible for whether the result can be acted on before the time window closes.
For readers outside China
- Availability: The ledger gives a website for Qiewen Academic at https://qiewenpaper.com/zh. No source in the ledger states availability outside China for Qiewen Academic, Microsoft 365, or Blend Autopilot Analytics Agent.
- Pricing: For Microsoft 365, the ledger says Microsoft will raise the supply cost later this month, and the software price will be adjusted accordingly after that. For Qiewen Academic, an 8% discount coupon code 197720 is available for pro and higher monthly or annual memberships, with validity ending on 2026.8.29. No source in the ledger gives a base price for Qiewen Academic or Blend Autopilot Analytics Agent.
- Closest Western equivalents: Excel pivot tables; Codex; Blend Autopilot Analytics Agent; Glassbox
- Data residency: The ledger says Qiewen Academic can connect to a remote server, check SSH, GPU memory, RAM, and Python version, and choose a recent PyTorch + CUDA image, but it does not disclose where data is stored or processed. For Blend and Glassbox, the ledger does not disclose data-residency details.
Sources
- sspai [限时优惠] 数据分析:用好 Excel 中的数据透视表 https://sspai.com/post/113108
- appinn 复旦「学术版 Codex」:从找 Idea 到跑实验,一句话全自动 https://appinn.com/qiewenpaper-codex
- woshipm AI 能秒级出报表,为什么业务还是来不及? https://woshipm.com/ai/6442626.html
- woshipm AI数据分析规范(Codex,Trae,Deepseek通用版) https://woshipm.com/share/6443071.html
The evidence: 61 facts from 4 Chinese articles
Each line below was extracted from the article it sits under, in Chinese, before any of this was written. The writing is done from these and never from the source prose - that separation is structural, not a promise. How we work.
appinn复旦「学术版 Codex」:从找 Idea 到跑实验,一句话全自动
- Fudan University's NLP team has built an academic agent called Qiewen Academic, described as an "academic version of Codex".
- Qiewen Academic has a website at https://qiewenpaper.com/zh.
- The paper-reproduction function can upload a PDF and automatically assess experiment difficulty, code usability, and the number of A100 or H100 GPUs needed.
- The system supports multiple GPU models, including A800.
- The system automatically selects a recent PyTorch + CUDA image.
- The system can connect to a remote server by itself and check SSH, GPU memory, RAM, and Python version.
- When it encounters dependency conflicts such as Transformers 4.52 vs 5.3, it can try downgrading packages and rewriting related scripts until the pilot test runs successfully.
- The system can deeply search the web, identify the main limitations of existing papers, and tell the user whether an idea has already been proposed, which work is closest, and how the differences are essential.
- The system can be given a long task such as downloading 200 papers, writing a literature review in 9 categories, and producing more than 1000 words per paper with figures and formulas included.
- The article says the system can produce a literature review of more than 200,000 Chinese characters overnight.
- The system provides semantic deep search, knowledge-base chat, full-text translation that preserves formulas, charts, and layout, and intelligent tracking subscriptions.
- An 8% discount coupon code 197720 can be used for pro and higher monthly or annual memberships.
- The coupon code 197720 is limited in time and quantity, and its validity ends on 2026.8.29.
sspai[限时优惠] 数据分析:用好 Excel 中的数据透视表
- This is a free trial reading excerpt of an exclusive customized tutorial included in the Microsoft 365 tool value pack.
- Microsoft will raise the supply cost of Microsoft 365 subscriptions later this month.
- The software price will be adjusted accordingly after Microsoft raises the Microsoft 365 supply cost.
- The promotion lets buyers purchase Microsoft 365 at the event price before the price adjustment, on top of the original sale price.
- The article says there are nearly 600 rows of historical sales data in the source Excel table.
- In the sales data example, the G column contains satisfaction scores.
- Selecting the entire G column in Excel shows an average satisfaction value of 84%.
- In the example, East China has a satisfaction score of 74%, which drags down the national average of 84.
- A pivot table can generate a satisfaction report by region by dragging the Region field into Rows and the Satisfaction field into Values, then changing the calculation to Average.
- A pivot table can also be used to quickly generate satisfaction statistics by store type or by product line.
- Pivot tables can turn one-dimensional data into a two-dimensional display by placing fields in Columns and Rows.
- The article uses an income example in which Region and Product are placed into Rows and Columns to produce a regional-product revenue table.
- Pivot tables can create custom metrics through calculated fields.
- The article gives profit margin as an example of a calculated field, using profit margin = (income - cost) / income.
- The Group function in a pivot table can aggregate monthly data into quarterly data.
- The article says numeric fields can also be grouped, and it gives an example of grouping income from 10000 to 20000 in intervals of 1000.
- A slicer in a pivot table works as a quick filtering tool that updates the pivot table and related chart data when different option combinations are clicked.
- Pivot tables can be used to quickly merge identical values into merged cells for formatting purposes.
woshipmAI 能秒级出报表,为什么业务还是来不及?
- SoFi had 546 same-type failed loan application sessions in one week.
- In those SoFi sessions, users received error messages and did not complete their applications.
- Glassbox's anomaly detection alerted SoFi before the technical problem entered SoFi's field of view.
- SoFi's business and technical teams classified the issue as high priority, used session replay to find the root cause, and fixed it on the same day.
- Glassbox estimated that if the failure lasted for one year, it could cause more than 28,000 abandoned applications and more than $9 million in potential annual losses.
- On August 4, Blend released Autopilot Analytics Agent.
- Autopilot Analytics Agent supports natural-language querying, real-time loan funnels, threshold alerts, and collaborative dashboards.
- Blend described its product with the title: "Run this month's pipeline, not last month's report".
- The article defines "action window" as the time between when a signal reaches executable reliability and the latest point when intervention can still significantly change the outcome.
- The article says action window is not the same as an alert SLA.
- Blend said that in its own network, the share of retail mortgage applications that go from start to submission is only 60%-70%.
- The article says a closed campaign can have a 30% conversion-rate drop, while a still-running campaign with only a 5% drop and four hours left may be more worth handling immediately.
- The article proposes three time measures for the product: current remaining window, Time to Intervention, and window hit rate.
- Current remaining window is defined as the time from now until the latest effective intervention time.
- Time to Intervention is defined as the total time from a signal reaching executable reliability to the time the prescribed action is completed and enters an effective state.
- Window hit rate is defined as the share of events, after confirming that the signal reached executable reliability and that execution conditions existed, that completed the prescribed action before the window closed.
- The article says AI does not need to be real-time in every scenario.
- The article says strategic problems with a weekly window may only need daily reports and manual review.
- The article says scenarios with only a few minutes of window, reversible actions, and mature rules are the ones worth tightly connecting identification and execution.
woshipmAI数据分析规范(Codex,Trae,Deepseek通用版)
- The article discusses AI data analysis standards for Codex, Trae, and Deepseek.
- The article says that the output of data analysis is valuable only when many of its conclusions are actually used by the business.
- The article says that if a business does not understand its situation, the first step is to build an indicator system and monitor data.
- The article says that if a business lacks decision criteria, the first step is to collect indicator trends, industry data, and KPI breakdowns to establish standards.
- The article says that if a business does not know why performance is poor, the first step is to find problem points, build business hypotheses, and verify them one by one.
- The article says that if a business lacks a solution, the first step is tag analysis, finding benchmarks, and then proposing suggestions.
- The article says that a useful way to describe data requests is in the format of indicator + dimension + operation.
- The article lists nine steps for monitoring an analysis system, starting with the main indicator, then comparing it with a standard, and then breaking down by dimensions and sub-indicators.
- The article says that for causal inference or forecasting problems, users should prepare hypotheses and supporting data before asking AI to build models.
- The article says that a useful modeling prompt is to define X and Y indicators, perform descriptive statistics on X, suggest feature engineering, and then model with an XX model.
- The article is written by 接地气的陈老师 and was originally published or authorized on the WeChat public account 接地气的陈老师.